
Why did my YouTube views drop? You open YouTube Studio and the graph has fallen off a cliff. Last month, your videos were pulling steady numbers. This week, they are stuck at a fraction of that. Same publishing schedule. Same format. Same team. So what changed?
Here is the frustrating part: most advice jumps straight to “post more Shorts” or “make better thumbnails.” That is like prescribing a treatment before finding the cause. A view decline has several possible explanations—seasonality, fewer impressions, weaker click-through rate, lower retention, a change in traffic sources, shifting search positions, audience fatigue or simply one viral video rolling out of your comparison window.
This guide gives you a practical seven-step diagnosis. You will learn what to compare, how to read YouTube Studio’s reports without overreacting, and what to fix first. We will also distinguish a genuine performance problem from normal fluctuations. Let’s break it down.

First: Don’t Blame “the Algorithm” Yet
YouTube’s recommendation system is designed to connect viewers with videos they are likely to watch and find valuable. There is not one universal switch that turns a channel’s views up or down. Search, Home, Suggested videos, Shorts and external sources behave differently and serve different viewer needs.
That means the right question is not “Did the algorithm punish me?” It is “Where did my viewers stop finding or choosing my content?” The answer is usually visible in your analytics. But you have to compare the right metrics, over a sensible period, and by format and traffic source.
Understand the View Funnel Before Changing Anything
For YouTube impressions, a useful diagnostic model is: impressions create opportunities to click; click-through rate (CTR) describes how often an impression becomes a view; and watch behaviour shows whether the video delivers on its promise. Not every view starts with a counted impression—external links and some other sources work differently—so treat this as a diagnostic model, not a complete accounting formula.
In plain English, a view decline can begin because fewer people were shown your video, fewer of the people who saw it chose to click, or fewer viewers continued watching. A change in one traffic source can also outweigh stable performance elsewhere.
And here’s the kicker: CTR should not be read by itself. YouTube notes that CTR can fall as impressions expand to a broader audience. That can accompany growth, not failure. Always compare impressions, CTR, watch time, audience retention and traffic source together.

Step 1: Check Whether the Drop Is Real or a Comparison Effect
Before you redesign your channel, check the date range. Compare the last 28 days with the previous 28 days, then look at a longer period such as 90 days. For seasonal businesses, compare with the same period last year when that data is available.
Watch for two traps:
- Seasonality: Interest in education, shopping, travel, finance and events can rise and fall throughout the year. A category-wide dip may reflect demand, not a sudden failure in your channel.
- Outlier videos: One unusually popular upload can make the next month look like a collapse. Compare your baseline after accounting for that outlier.
- Incomplete reporting: Some analytics take time to process. YouTube says audience-retention data typically takes one to two days to become available, so do not make a final call from incomplete recent data.
You might be wondering how to separate seasonality from channel-specific change. Compare similar topics and formats, review search interest and check whether other channels in your category are seeing similar patterns. Treat competitor observations as context, not proof: public view counts do not reveal their impressions, CTR or retention.
Step 2: Find Out Whether Impressions or CTR Changed
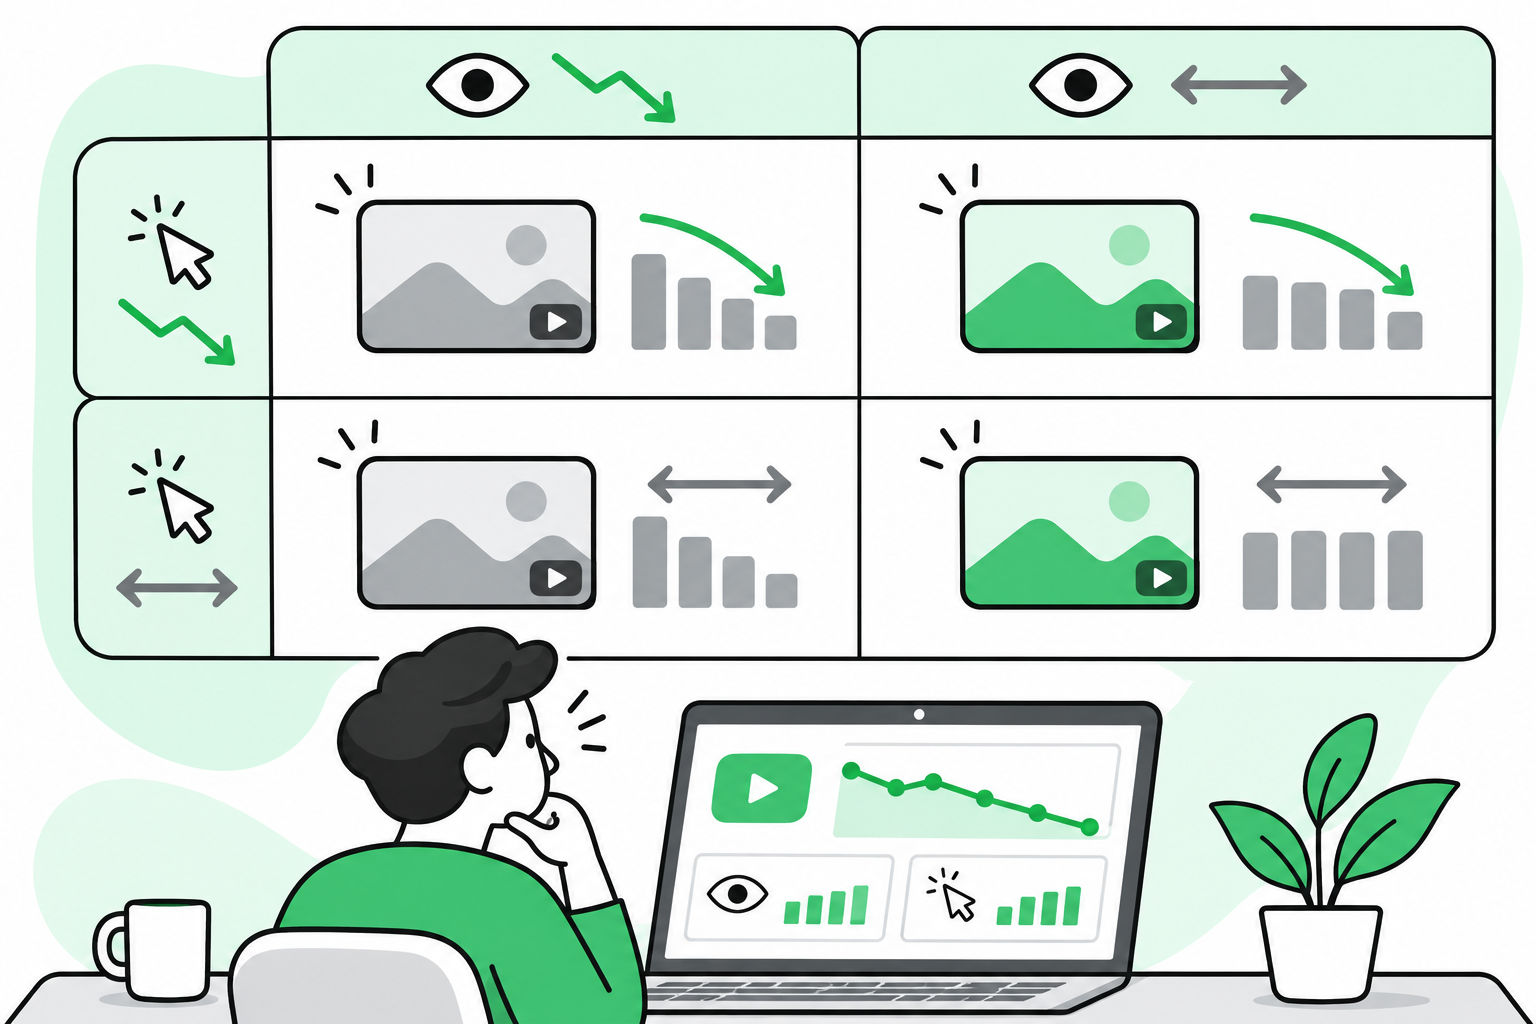
In YouTube Studio, open Analytics and review the Reach or Content reports for the affected videos. Compare impressions and impressions click-through rate with a previous period and with your own typical performance. Do not rely on a single channel-wide average when the content mix has changed.
| What changed? | What it may indicate | What to inspect next |
|---|---|---|
| Impressions down, CTR broadly stable | Fewer opportunities to be seen; source mix, topic demand or viewer response may have shifted | Traffic sources, retention, topic relevance and comparison period |
| Impressions broadly stable, CTR down | Fewer viewers chose the video when shown; the audience or context may have changed | Title/thumbnail promise, traffic source mix and comparable videos |
| Impressions down, CTR up | Reach may have narrowed toward a more interested audience | Watch time, source mix and whether total views or satisfaction also changed |
| Both impressions and CTR down | Several factors may be changing at once | Topic demand, packaging, retention, audience fit and traffic sources |
This table is a starting point, not a verdict. CTR varies by traffic source and by audience. A high CTR from Search and a lower CTR from Home can both be normal because viewers arrive with different intent. Compare like with like whenever possible.
Step 3: Read Audience Retention, Not Just Average View Duration
Average view duration compresses a video into one number. The audience-retention graph shows where viewers stayed, skipped, rewatched or left. Open the affected video’s Analytics and inspect the retention report. Compare it with videos of similar length and format, including your own typical results.
- A sharp early drop: The opening may not match the title and thumbnail promise, or the introduction may take too long to reach the point.
- A recurring mid-video dip: Look for a slow section, repeated explanation, long transition or segment that could be tighter.
- A spike: Viewers may be rewatching or sharing that moment. Check what you said or showed there; it may be a useful idea for future videos.
- A steady decline: Some drop-off is normal. Compare against similar-length videos and focus on avoidable dead zones, not a fantasy of perfect retention.
Retention tells you where behaviour changed. It does not, on its own, prove why. Rewatch the relevant moments and compare the promise, pacing and clarity. Then make one targeted edit to the next video rather than changing your entire format at once.
Step 4: Identify Which Traffic Source Fell
Open the “How viewers find your content” or traffic-source report. Compare Browse features, Suggested videos, YouTube Search, Shorts feed, notifications, playlists and external sources separately. YouTube classifies sources in its Analytics reports; source names and available detail can vary by content type and report.
- Browse features declined: Check Home and other browsing surfaces, then review whether the affected topics and videos are still resonating with your intended viewers.
- Suggested videos declined: Check which videos used to send viewers to you and whether your new uploads form a clear topical next step.
- YouTube Search declined: Inspect the search terms and videos involved. Demand, relevance and competing results can all change.
- Shorts feed declined: Evaluate Shorts separately from long-form videos. Look at shown-in-feed and viewed-versus-swiped behaviour where available, and avoid interpreting a single short window as a permanent trend.
- External traffic declined: Check whether a campaign, newsletter, embed or social referral stopped sending viewers.
- Playlist traffic declined: Review playlist ordering, descriptions and whether videos still connect naturally.
The goal is to replace “my views are down” with a more specific observation: “Search views fell on these videos,” or “Browse impressions declined while CTR stayed close to normal.” Specific diagnosis leads to a useful next action.

Step 5: Investigate Search Performance and Keyword Movement
YouTube Studio can show search terms that brought viewers to your videos. Review those terms and the videos receiving that traffic. A decrease may reflect lower search interest, a changed result page, a competitor’s newer or more relevant video, or a mismatch between the query and your content.
Be precise about what you know. Studio’s query report is not the same thing as a complete, guaranteed rank tracker. Search results can vary by viewer and context. If you use third-party rank monitoring, treat it as an external observation and validate the pattern in your own traffic data.
When a valuable topic weakens, do not immediately publish a duplicate. Review the current results, identify what viewers still need, and decide whether an updated explanation, a clearer demonstration or a more complete video would genuinely help. Then connect the new video to relevant playlists and related content.
Step 6: Check Audience Fit and Competitor Context
Public competitor views can show that a topic is attracting attention, but they cannot tell you what the competitor’s retention or impression funnel looks like. Use competitor review to generate hypotheses, not to claim that another channel “stole” your views.
Review a small set of comparable channels and ask:
- Are they covering a new audience question or a different angle?
- Do their titles and thumbnails make a clearer promise?
- Are they publishing a series that gives viewers an obvious next video?
- What questions appear repeatedly in comments across the topic?
- Are you serving the same audience, or have you drifted into a different subject area?
For most channels, coherence matters: make content that your intended viewers are likely to want next. If a new topic attracts a different audience, test it deliberately and assess the response before rebuilding the whole channel around it.
Step 7: Check Timing, Format and Reporting Changes
Look for publishing gaps, format changes, deleted or private videos, copyright or policy notices, altered campaign support and reporting changes around the date of the drop. Compare Shorts with Shorts and long-form with long-form. A change in upload mix can make combined channel totals misleading.
If you suspect a platform-wide change, consult YouTube’s official Help Center and Creator communications for the relevant dates. Avoid treating social-media speculation as confirmation. YouTube’s own guidance explains that impressions, CTR and traffic sources need context; it does not provide one universal CTR target that applies to every video.
And one caution: “the algorithm changed” is an easy explanation, but it is not a diagnosis. Start with your data. If a platform change did occur, you still need to know which of your videos and traffic sources were affected.
How to Fix Low YouTube Views Once You Find the Cause
| Likely cause | First action to test |
|---|---|
| Seasonal or topic demand changed | Plan evergreen content for slower periods and align timely topics with actual audience interest. |
| CTR weakened in a comparable source | Test a clearer, more accurate title or thumbnail that represents the video—not a louder promise. |
| Early retention weakened | Shorten the setup, deliver the promised value earlier and make the opening match the packaging. |
| Browse or Suggested traffic declined | Review audience fit, satisfaction signals, series continuity and relevant end screens or playlists. |
| Search traffic declined | Review affected queries and results; create an updated, genuinely more useful answer where warranted. |
| External referrals declined | Check campaign links, embeds and referral sources; restore only the channels that still fit the audience. |
| Format mix changed | Evaluate each format separately and compare like-for-like periods. |
Here is a simple example. Suppose a video’s impressions fall from 200,000 to 120,000 while CTR stays at 5%. The impressions-based views would move from about 10,000 to about 6,000, all else equal. That illustrates why a stable CTR does not rule out an impressions problem. It does not prove why impressions changed; you still need to inspect traffic sources, topic context and viewer response.
Do not change five things at once. Pick the most likely cause, make one or two targeted changes, and compare results over a period long enough to collect useful data. Keep notes. A fix is only useful if you can tell what changed.
Why Manual Diagnosis Gets Hard at Scale
For one channel, a few videos and a simple reporting cadence, YouTube Studio may be enough. The workload changes when a brand or agency monitors multiple channels, formats, competitors and search themes every week. Data can end up scattered across exports, spreadsheets and separate tools, making it harder to see a repeated pattern.
That is the problem video intelligence is meant to solve. Lumetrics is a Video Intelligence Platform with 10 AI modules across YouTube + Instagram. Its YouTube Keyword Rank capability is designed to help teams monitor search positions alongside competitor and audience signals. Use that kind of view to form a clearer content brief—not as a substitute for the source data or as a promise that any tool can guarantee views.

Instead of ending a review with “views are down,” a team should be able to state what fell, which audience or source changed, what evidence supports the diagnosis and what experiment comes next.
Want to see how that workflow could look for your brand? Book a 30-min live demo.
FAQs
Why did my YouTube views drop suddenly overnight?
Start by checking which traffic source changed and whether the comparison includes a viral outlier or an incomplete reporting window. A sudden-looking channel decline can come from one major video or source; compare like-for-like content and periods before changing your strategy.
Why are YouTube impressions dropping but CTR is the same?
Stable CTR with fewer impressions means thumbnails are converting at a similar rate among the people who see them, while the video is being shown less often. Review traffic sources, topic demand, audience response and retention to investigate why. The pattern alone does not identify a single cause.
Does YouTube punish channels for not posting regularly?
A gap in uploads does not by itself prove a penalty. Fewer uploads can mean fewer new opportunities to reach viewers, and returning-viewer habits may change. Focus on a sustainable cadence and content your intended audience wants, rather than posting purely to satisfy an assumed algorithm rule.
How long does it take for YouTube views to recover after a drop?
There is no reliable universal recovery timeline. A seasonal dip may resolve as demand returns. A packaging, retention or topic-fit problem may require several deliberate tests and new uploads. Track the affected metric and source rather than expecting every view count to bounce back immediately.
How can I tell if competitors are outperforming my YouTube videos?
Compare public topics, upload timing, titles, thumbnails and audience questions, then compare your own search and suggested traffic reports. Public competitor view counts cannot reveal their private impressions, CTR or retention, so use them as context—not as proof of why your views changed.
Leave a Reply